White Paper Series
Basic Shading Concepts for PV Arrays
March 2010
Principle Consultant
Solar Site Services
Williamstown, NJ
www.solarsiteservices.com
The Sun Path Diagram
Shading analysis is based on a sun path diagram, which basically indicates how the sun moves across the horizon at a given latitude. Sun paths have been known for hundreds, maybe thousands of years. Nowadays, computer programs have determined precisely the sun’s positioning for us, so we simply need to know the observation point to determine the sunpath associated with that point.
The higher the latitude (northern hemisphere), the lower the sun. In the morning the sun rises in the east and in the evening it sets in the west. How ‘high’ the sun is relative to the ground is the elevation angle. At 12 noon the sun is highest. During the winter months the sun has a much lower elevation angle than in the summer months. What’s important is that for a given observation point, one can use the sun path diagram to determine the sun’s height at any hour of the day. So, for example, if one wanted to know the height of the sun for a given observation point at 10AM in April, he needs only look at the diagram and the elevation angle is given. More useful, for that given observation point, is that all hours of the day are shown for all months of the year.
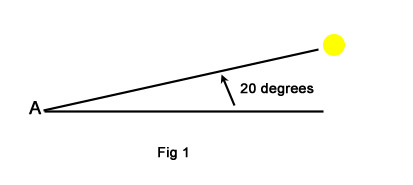
Figure 1 shows that for a given observation point A, the sun’s height is at 20 degrees. This measurement would be at a particular time of day and month of the year.
Now, looking at fig 2, one sees where an obstruction, say a tree, has been placed in the sun’s line at that particular measurement time.
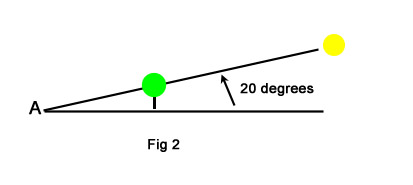
In this case, we would say point A is shaded at that particular point in time.
Data Collection
The above two figures provide a foundation for all shading analysis. At point A all solar elevation angles are known for all hours and all seasons. If there are any obstructions like that noted in figure 2, for any of those times, then we can determine the overall shading at point A. In other words, while figure 2 indicates the shading for one azimuthal angle, all azimuthal angles from sun-up to sun-down, can be observed and recorded. There might be additional obstructive objects at other azimuthal angles. When we add up the total effect of each of those individual effects, then we can make a reasonable judgment of how much point A is shaded.
If we extend our analysis scope from point A to other points on the surface we want to examine, we’ll be able to estimate an overall ‘total roof shading’ effect by averaging the shading.
For example, point A might be at a bottom right corner of a solar array. Another point at B might be at the lower left corner, and so on. If we are trying to determine the total array shading effect, then a simple average of such points should suffice as average roof shading. Figure 3 shows that there could be multiple obstructions that shade point A.
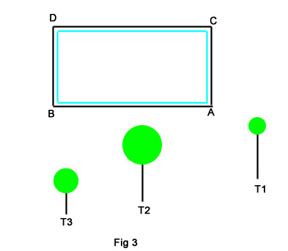
While obstruction T3 may not have much effect of the right side of the array, points A and C, one could expect a significant effect on the left side, points B and D. Consequently, the question of how much an array is shaded, cannot be straightforwardly answered. It is really an estimate based on averages.
Fig 3 assumes that True south is vertically downward. If the True south were 20, 45, or even 90 degrees to either side of vertical, then the shading impacts would vary considerably. These effects are dependent on how high and far distant the obstructions are from the observation point.
Additionally, obstructions which tend to shade the lower portion of an array will have a much greater impact on panels laid portrait rather than landscape, as most, but not all, panel manufacturers place bypass diodes on the shorter panel side.
It is also worth mention that the sunpath method, along with the tools approach, which follows, only account for direct sunbeam shading effects. Relevant sunshine landing on a surface also has an indirect component which can be significant for some locations. Crystalline panels do not produce as much per KW as thin film panels, relative to indirect sunshine. Therefore, in some locations there are economic tradeoffs that could favor thin film over crystalline panels.
Analysis Tools
While the sunpath diagram is the grassroots basis for shading analysis, a number of tools simplify the analysis by integrating the results instead of compiling them individually. A Solar Pathfinder, for instance, has a curved lens which simulates the horizon so that, at a given measurement point, all objects on the horizon that might shade, are shown. Beneath the lens a sunpath template for that latitude shows the hours of the day and months of the year. Solar Pathfinder suggests a user to outline the shaded portions with a white crayon for further analysis. Most practitioners simply photo the pathfinder at each analysis point and analyze the results later. Note that the pathfinder measurement is taken at several observation points to get an overall average.
Other tools basically do the same integrations. In all cases the sunpath analysis approach can be used instead but the tools provide a shortcut in terms of time.
Where the sunpath approach is required is when the roof points cannot be easily gotten too. An example is where there is a very high and steep roof. About all one can do with the tool is to get close to the desired point to take some readings and then make some deductions therefrom. Another more complex situation arises where there are multiple trees or obstructions in tandem. The image shown by the tool will show the front obstruction, which may be on the premises of the site owner, while a second or third obstruction may be just behind it on another property. The suggestion that the closest tree be trimmed or cut may have little impact on what’s behind it. In this case a time consuming, detailed sunpath approach is the only option.
Shading Analysis
Once shade observations have been taken at multiple points, such readings are entered into ‘buckets’ of shade for each clock time period by month. There is more sunlight in the summer months and, depending on array tilt, an hour’s shade at 2 PM in the afternoon in the winter will be different than an hour’s shade at 2 PM in the summer. But this is very dependent on tilt and azimuth of the array. An array tilted at 60 degrees will be more productive in the winter than summer but that is seldom done since summer production is usually maximized (there are more summer sunlight hours). Trackers solve this productivity issue but are seldom used outside of field groundmounts for a number of reasons.
Many vendors have developed shading programs which take the inputs from tools or direct sunpath analysis to cumulate the buckets of shade for each observation point. These programs are quite useful for their convenience and enable good shading estimates for most applications. And thankfully, most agents analyzing such outputs are using the same or similar tools. That operational consistency facilitates action for financial incentive approval, for example, but does not necessarily mean such results are indicative of shading reality. A number of papers have been written showing that even a single thin pole obstruction creates more shade on an array, as it works it’s way across the array following the sun, than what would be shown with existing tools. That is an advanced topic not covered here.